Here’s what I want on election night: A complete list of all Harris’s paths to victory and a complete list of all Trump’s paths. Then as each path becomes impossible, I can cross it off and see possibilities narrowing down.
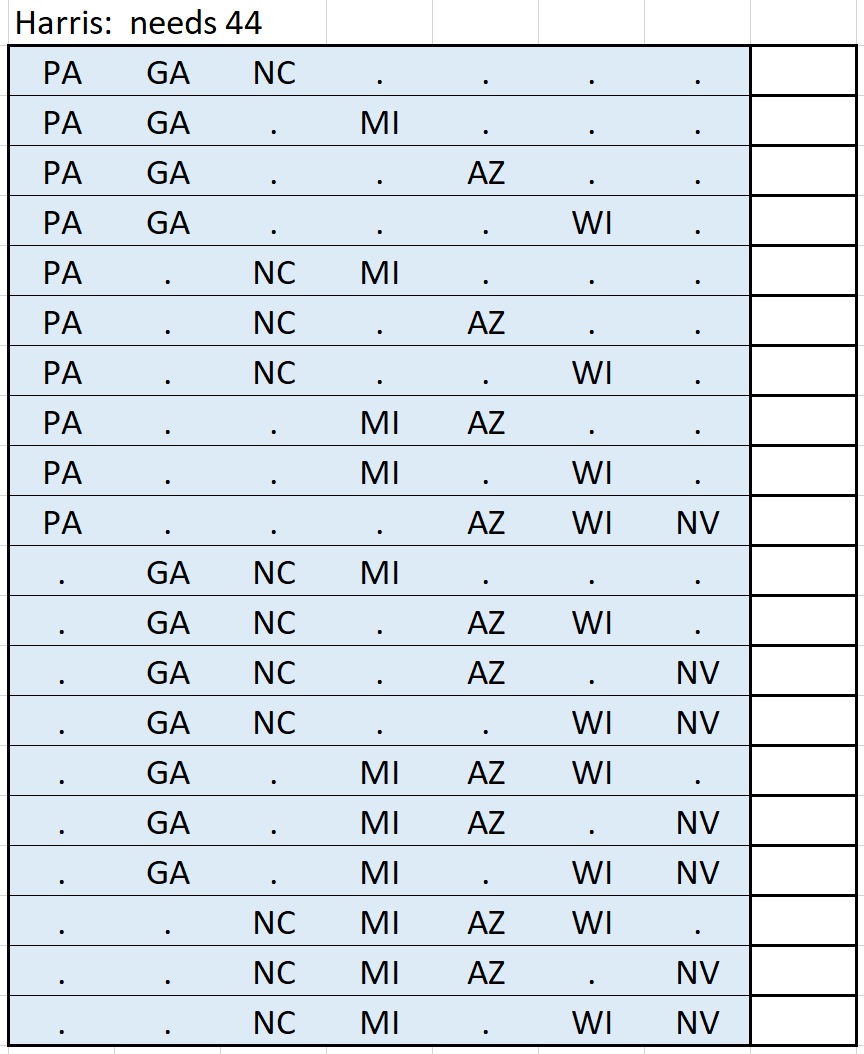
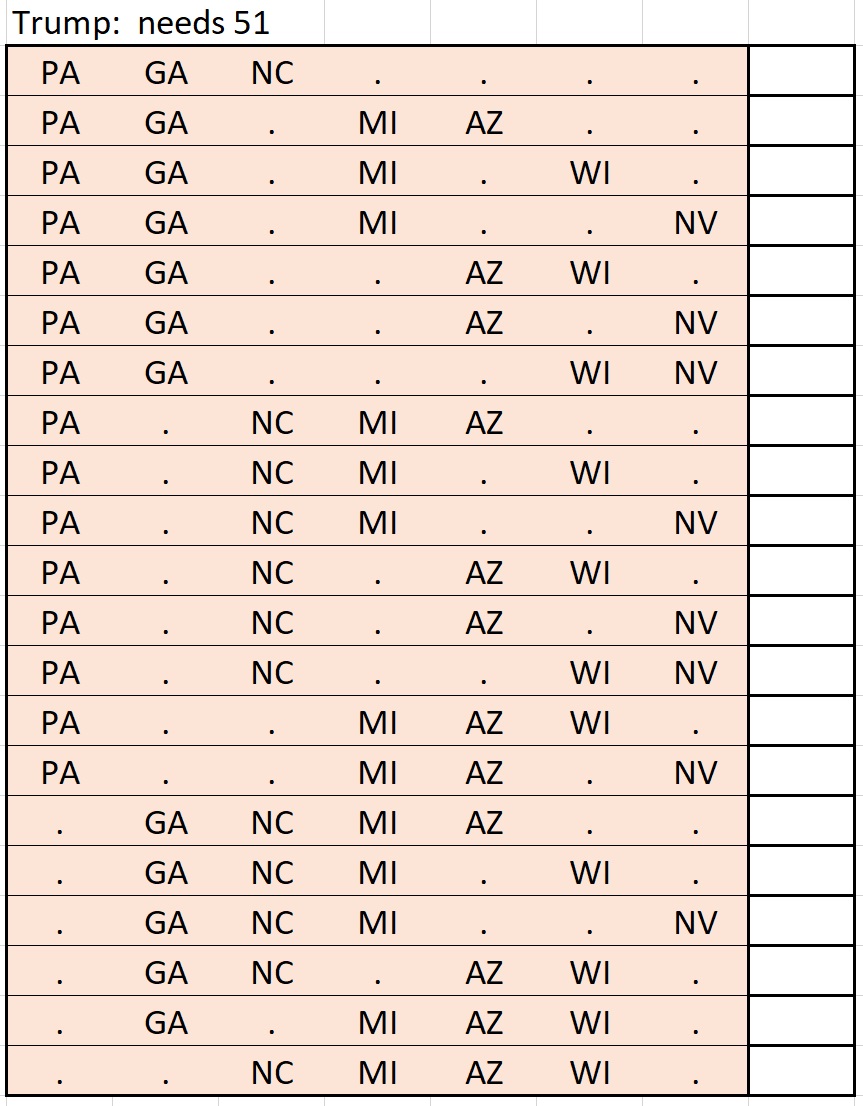
Of course the meaning of “all Harris’s paths to victory” depends on your background assumptions. For starters, I assumed that the seven oft-cited “battleground states” (PA, GA, NC, MI, WI, AZ, NV) are up for grabs and that all other states (and districts) will fall as expected, where “as expected” means “to the candidate who is currently ahead in the RealClearPolitics polling average”. This leaves 20 paths to victory for Harris and 21 for Trump, as shown:


Here’s exactly what this means: If Harris wins any one of her 20 combinations, she wins the race. If she fails to win any of them, she loses.
So for example, if Trump wins Pennsylvania early, I can cross off Harris’s top 10 rows, leaving her 10 paths to victory. If she loses Georgia, I cross off another 7 and she’s down to 3 paths.
Incidentally, there are also three paths to a tie, as indicated here:

Of course you might not believe that only seven states are up for grabs. So for my second pass, I assumed that seventeen “states” are up for grabs. These are the states that appear, from the RealClearPolitics averages, to be at least barely contestable. They are TX, FL, PA, OH, GA, NC, MI, VA, AZ, WI, MN, NV, NM, NH, ME, NB-2, and ME-2. (The latter two are actually congressional districts, not states.)
Now (unless I’ve made a mistake somewhere) Harris has 1922 paths to victory. Rather than post a 1922 line chart, here is a link to a 37-page pdf document. I plan to have this in front of me on election night.